Convenience base-graphics-like layer around scattermore. Currently only works with linear axes!
scattermoreplot(
  x,
  y,
  xlim,
  ylim,
  size,
  col = grDevices::rgb(0, 0, 0, 1),
  cex = 0,
  pch = NULL,
  xlab,
  ylab,
  ...
)
Arguments
- x, y, xlim, ylim, xlab, ylab, ...
used as in
graphics::plot()or forwarded tographics::plot()- size
forwarded to
scattermore(), or auto-derived from device and plot size if missing (the estimate is not pixel-perfect on most devices, but gets pretty close)- col
point color(s)
- cex
forwarded to
scattermore()- pch
ignored (to improve compatibility with
graphics::plot()
Examples
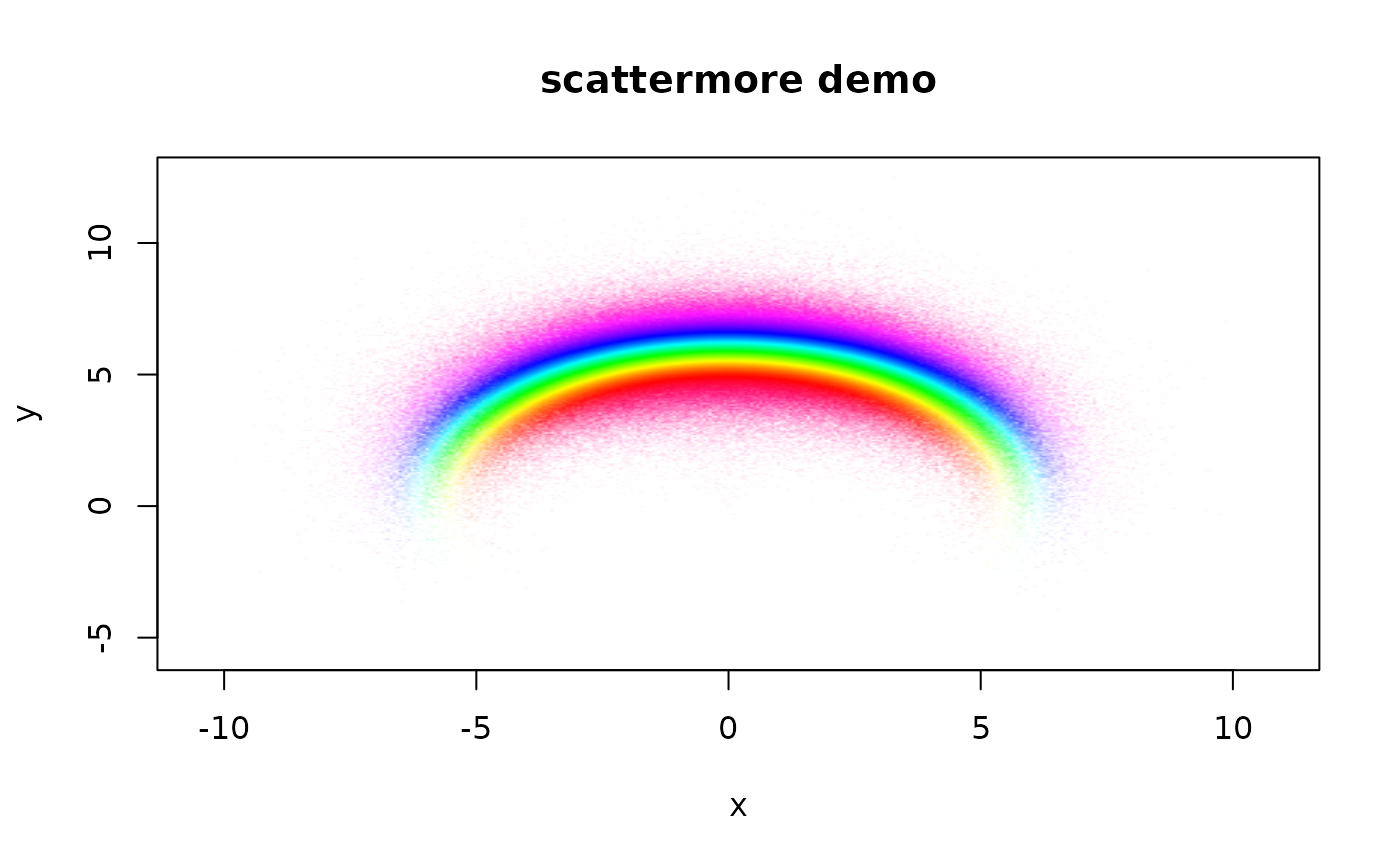
# plot an actual rainbow
library(scattermore)
d <- data.frame(s = qlogis(1:1e6 / (1e6 + 1), 6, 0.5), t = rnorm(1e6, pi / 2, 0.5))
scattermoreplot(
  d$s * cos(d$t),
  d$s * sin(d$t),
  col = rainbow(1e6, alpha = .05)[c((9e5 + 1):1e6, 1:9e5)],
  main = "scattermore demo"
)
