ggplot2::ggplot() integration. This cooperates with the rest of ggplot
(so you can use it to e.g. add rasterized scatterplots to vector output in
order to reduce PDF size). Note that the ggplot processing overhead still dominates
the plotting time. Use geom_scattermost() to tradeoff some niceness and
circumvent ggplot logic to gain speed.
geom_scattermore(
  mapping = NULL,
  data = NULL,
  stat = "identity",
  position = "identity",
  ...,
  na.rm = FALSE,
  show.legend = NA,
  inherit.aes = TRUE,
  interpolate = FALSE,
  pointsize = 0,
  pixels = c(512, 512)
)
Arguments
- mapping, data, stat, position, inherit.aes, show.legend, ...
passed to
ggplot2::layer()- na.rm
Remove NA values, just as with
ggplot2::geom_point().- interpolate
Default FALSE, passed to
grid::rasterGrob().- pointsize
Radius of rasterized point. Use
0for single pixels (fastest).- pixels
Vector with X and Y resolution of the raster, default
c(512,512).
Details
Accepts aesthetics x, y, colour and alpha. Point size is fixed for
all points. Due to rasterization properties it is often beneficial to try
non-integer point sizes, e.g. 3.2 looks much better than 3.
Examples
library(ggplot2)
library(scattermore)
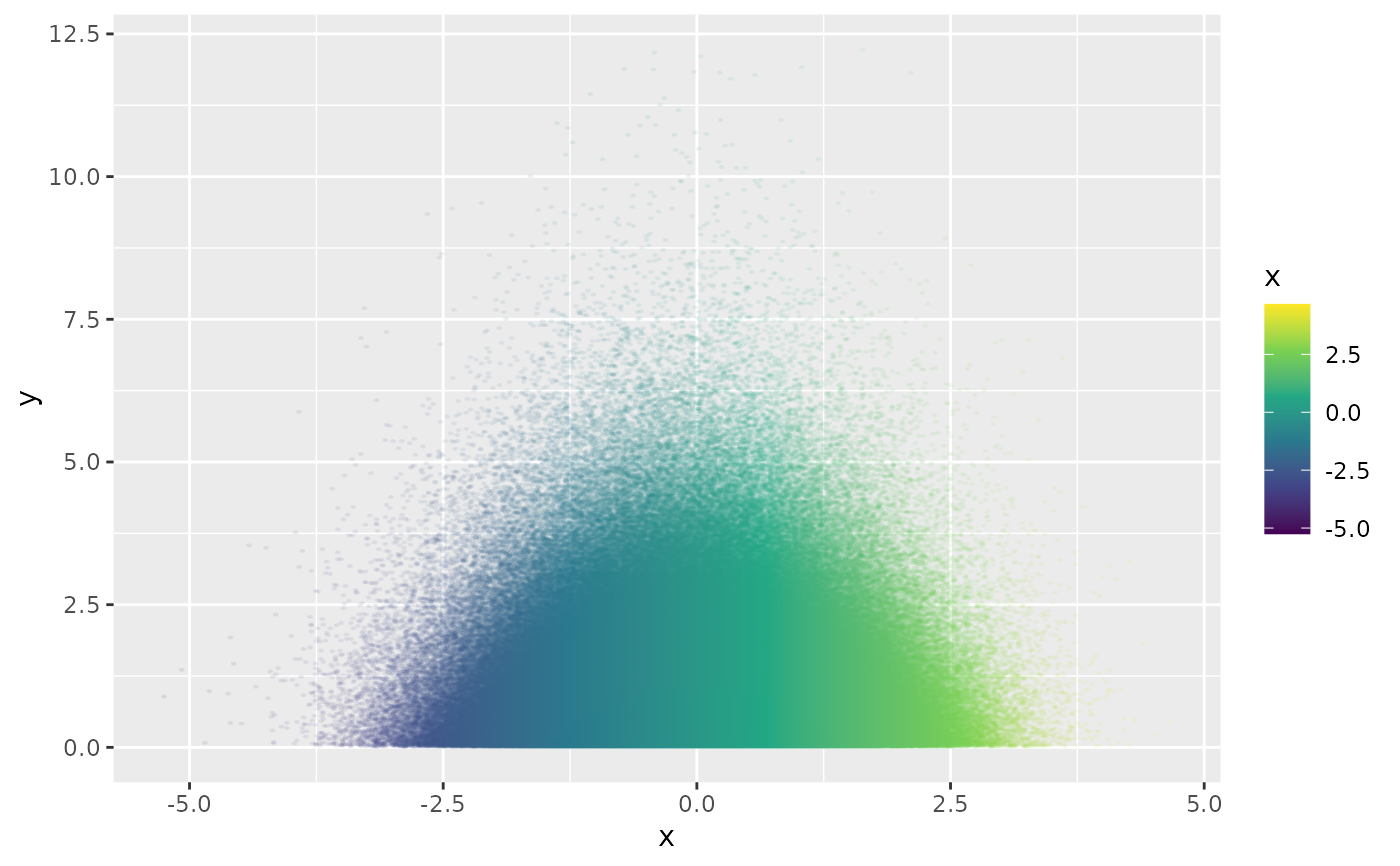
ggplot(data.frame(x = rnorm(1e6), y = rexp(1e6))) +
  geom_scattermore(aes(x, y, color = x),
    pointsize = 3,
    alpha = 0.1,
    pixels = c(1000, 1000),
    interpolate = TRUE
  ) +
  scale_color_viridis_c()
